Showing posts with label Trader Education. Show all posts

Friday, 2 October 2026

If the Federal Reserve Board is So Smart, I’d Hate to See What Dumb Looks Like!

By Elliott Wave International

The federal government is now spending about $1.25 trillion a year just to pay interest on the $40 trillion national debt.

There are of course the usual suspects: profligate spending, bureaucracy, lack of accountability, waste.

How did we get here?

For years, the U.S. government borrowed money at historically low interest rates, a real gravy train. And in 2020, the Fed’s expectation was that those rates would stay low for years.

Take a look at this chart:

Interest rates rose from 1942 to 1981. Then they spent roughly 40 years trending lower, reaching historic lows by 2020.

At the time, there was little reason to believe — at least according to the conventional view — that things were about to change. In September 2020, Federal Reserve Chairman Jerome Powell told reporters that the Fed expected short-term interest rates to remain near zero for at least three years, through the end of 2023.

It made sense to almost everyone. The economy was still dealing with the effects of the pandemic, inflation was subdued, and the Federal Reserve was providing extraordinary monetary stimulus.

Besides, who would ever doubt the Fed chairman?

Analysts at Elliott Wave International saw things very differently. And they put it in print for the world to see.

On September 23, 2020, The Elliott Wave Theorist addressed the Fed's outlook directly:

“On September 16, Fed Chairman Powell…told reporters that he expected short term interest rates to stay near zero…through ‘the end of 2023.’ …there is not a chance in the world of that scenario playing out. The probability is high that interest rates have begun a process of rising….”

That's a stark difference.

The Fed was telling investors to continue to expect near-zero rates for years. EWI was saying that the gravy train was OVER. Rates had bottomed.

And then look at what happened:

Rates rose across all time frames. Some, like 10-year yields, went up tenfold. T-bill rates that had been hovering near zero ultimately surged above 5%, rising 100-fold!

The four-decade era of generally falling interest rates had given way to something very different – with enormous consequences for investors and for debtors, including the federal government.

Individuals, businesses and governments who had built their future plans around the Fed’s completely incorrect assumptions and prognostications were caught in a nightmare scenario.

Fast Forward to Today

This chart shows a close-up view of the yield on the 10-year U.S. Treasury note since 2020.

Today, as older government debt matures, some of it has to be replaced with new debt carrying substantially higher interest rates, contributing to the enormous $1.25 trillion annual interest bill.

And the effects of higher rates aren't limited to Washington — mortgages, home-equity loans, commercial real estate and longer-duration car loans are all feeling the pressure as the effects spread throughout the financial system — and NOT just in the U.S.

This Isn't Just Happening in America

While investors spend a lot of time wondering what the Fed will do next, long-term interest rates have been moving in some important ways around the world.

In Japan, for example, the 10-year government bond yield recently reached its highest level in 30 years.

Government bond yields in several other major economies have also been moving higher.

Remember how all this started. In 2020, economists agreed that ultra-low interest rates would stick around for years. EWI said the process of rising interest rates had already begun. Six years later, the U.S. is spending $1.25 trillion a year on interest. And a string of recent 30-year Treasury auctions has pushed borrowing costs to their highest levels in a quarter-century.

Get more insights like this when you sign up for EWI's free newsletter >>

This article was syndicated by Elliott Wave International and was originally published under the headline If the Federal Reserve Board is So Smart, I’d Hate to See What Dumb Looks Like!. EWI is the world's largest market forecasting firm. Its staff of full-time analysts led by Chartered Market Technician Robert Prechter provides 24-hour-a-day market analysis to institutional and private investors around the world.

Wednesday, 30 September 2026

What Every Trader Really Needs to be Successful: A Method

By Elliott Wave International

In 1984, Elliott Wave International Founder Robert Prechter won the United States Trading Championship with a then-record 444% return. After Bob won, many subscribers asked for a list of tips, or even a breakdown of his trades, to try and replicate his success. Bob knew that wouldn’t help, so instead, he created a short list of “rules” that every trader needs to be successful. Here’s one:


A Method

I mean an objectively definable method. One that is thought out in its entirety to the extent that if someone asks you how you make your decisions, you can explain it to him, and if he asks you again in six months, he will receive the same answer. This is not to say that a method cannot be altered or improved; it must, however, be developed as a totality before it is implemented. A prerequisite for obtaining a method is acceptance of the fact that perfection is not achievable. People who demand it are wasting their time searching for the Holy Grail, and they will never get beyond this first step of obtaining a method. I chose to use, for my decision making, an approach which was explained in our book, Elliott Wave Principle. I think the Wave Principle is the best way to understand the framework of a market and where prices are within that framework. There are a hundred other methods which will work if successful trading is your only goal. As I have often said, a simple 10-day moving average of the daily advance-decline net, probably the first indicator a stock market technician learns, can be used as a trading tool, if objectively defined rules are created for its use. The bad news is that as difficult and time consuming as this first major requirement can be, it is the easiest one to fulfill.


See 4 more “rules for success” in EWI's free Special Report, What Every Trader Really Needs to be Successful.

This article was syndicated by Elliott Wave International and was originally published under the headline What Every Trader Really Needs to be Successful: A Method. EWI is the world's largest market forecasting firm. Its staff of full-time analysts led by Chartered Market Technician Robert Prechter provides 24-hour-a-day market analysis to institutional and private investors around the world.

Tuesday, 8 September 2026

Elliott Wave Counting Exercise: Start Simple and Adjust Along the Way

By Elliott Wave International

A good Elliott wave count isn't necessarily the one you come up with first.

As price develops, the structure can provide new information — and your interpretation needs to account for it.

That's what makes this new lesson interesting.

Elliott Wave Counting Exercise: Start Simple and Adjust Along the Way takes you inside the process of building and refining a wave count. You'll see market veteran Favio Poci start with the big picture, work down into shorter-term structures, and use wave rules, channeling and Fibonacci relationships to assess what's developing.

If you're interested in the practical side of Elliott wave analysis, you can watch the full lesson for free at elliottwave.com – free.

Tuesday, 1 September 2026

Junk Bond Spreads Diverge Further From Stocks

By Elliott Wave International

One of the stock market’s important warning signs is getting louder. Junk bond spreads and equities usually move together. When they don’t, it’s worth paying attention. Check out this excerpt from Elliott Wave International's August 19 Short Term Update.

“[This chart] shows updated prices for both the S&P 500 and the Bloomberg CCC-rated junk bond yield spread, which is inverted … so that it aligns with stock prices. So, a declining line on the chart showing junk bond spreads means that spreads are widening, indicating increasing investor angst. Most of the time, junk bond spreads trend and reverse with equities. When the trends between the two sectors diverge, it is meaningful. …

“At the left side of the chart, junk bond spreads made a low in late June 2021 and started to widen thereafter, signaling coming trouble for stocks. Five months later the Nasdaq 100 index topped in November 2021 and started a 38% decline to October 2022. Seven months after junk spreads started to widen, the S&P topped in early January 2022 and subsequently declined 28% to October 2022.

“After the April 7, 2025 market low, junk bond spreads narrowed until late January of this year. … An aggressive widening trend has been underway since then, with spreads now at the same level as they were two years ago, in August 2024. ...”

This is just one of many signals EWI's analysts are tracking.

See 18 more flashing red signals inside their newly updated must-read report.

This article was syndicated by Elliott Wave International and was originally published under the headline Junk Bond Spreads Diverge Further From Stocks. EWI is the world's largest market forecasting firm. Its staff of full-time analysts led by Chartered Market Technician Robert Prechter provides 24-hour-a-day market analysis to institutional and private investors around the world.

Thursday, 20 August 2026

This Widely Held Belief About the Trade Deficit Is Wrong

By Elliott Wave International

Every day, forecasters make predictions based on the same old tools: economic fundamentals, valuation models, polls and so on. And every day, many of those predictions miss—sometimes spectacularly. The point isn’t that traditional analysts aren’t well-educated; it’s that just MAYBE what they learned is wrong. When the same methods keep producing “misses,” “unexpecteds,” and “surprises,” it’s fair to wonder whether there’s a better way to understand markets, politics and social trends. Elliott Wave International has spent decades exploring exactly that possibility.

The widespread assumption is that trade deficits are bearish. But what does the evidence show?

This chart, from The Socionomic Theory of Finance, reveals that had economists expressed relief whenever the trade deficit began to expand and concern whenever it began to shrink, they would have quite accurately negotiated the ups and downs of the stock market and the economy for 40 years.

Over the span of these data, there has been a consistently positive—not negative—correlation among the stock market, the economy and the trade deficit.

So, the trade deficit’s widely presumed effect is 100% wrong.

Learn what other assumptions you could be falling for when you read Chapters 1 and 2 of Robert Prechter’s book, The Socionomic Theory of Finance – free.

This article was syndicated by Elliott Wave International and was originally published under the headline This Widely Held Belief About the Trade Deficit Is Wrong. EWI is the world's largest market forecasting firm. Its staff of full-time analysts led by Chartered Market Technician Robert Prechter provides 24-hour-a-day market analysis to institutional and private investors around the world.
Thursday, 30 July 2026

How Do You Make Trading Decisions?

By Elliott Wave International

Every trade begins with a series of decisions.

How do you identify a high-confidence setup? What confirmation should you wait for before entering? Where should your stop-loss go? And what do you do if the market proves you wrong?

In this free 30-minute lesson from Elliott Wave International, Trading Instructor Favio Poci opens up his Elliott Wave Playbook and answers those questions using four real-market examples across Gold, EURGBP, GBPJPY and AUDJPY.

As each setup unfolds, you'll see how he:

  • Identifies potential Elliott Wave setups
  • Waits for confirmation before entering
  • Determines precise entry zones
  • Sets stop-loss levels and evaluates risk/reward
  • Adapts when price action doesn't go as planned

Perhaps the most valuable lesson: not every setup works as planned. Favio demonstrates that successful trading isn't about being right every time — it's about following a disciplined process for managing opportunities and risk.

Whether you're new to Elliott Wave analysis or looking to sharpen your trading approach, this lesson offers a practical look at how a market veteran applies the Wave Principle in real market conditions.

Watch the free lesson now at elliottwave.com.

Tuesday, 14 July 2026

How the Wave Principle Improves Trading: It Provides Price Targets

By Elliott Wave International

Technical studies do a good job of illuminating the way for traders, yet they each fall short for one major reason: they limit the scope of a trader’s understanding of current price action and how it relates to the overall picture of a market. Most technical studies simply don’t reveal pertinent information such as the maturity of a trend and a definable price target — but the Wave Principle does.

Here is one way the Wave Principle provides perspective:


Provides Price Targets

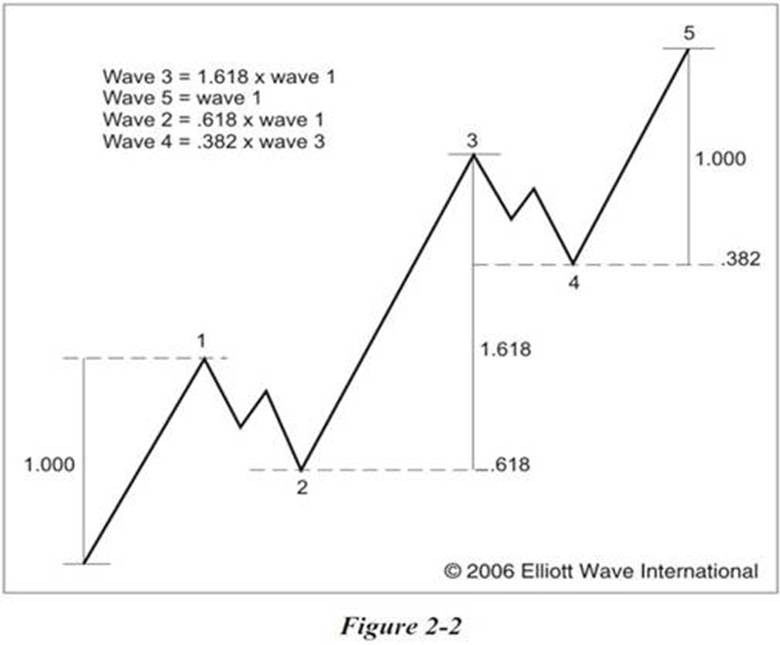
What traditional technical studies simply don’t offer — price targets — the Wave Principle again provides. R.N. Elliott observed that the Fibonacci sequence is the mathematical basis for the Wave Principle. Elliott waves, both impulsive and corrective, often adhere to Fibonacci proportions, as illustrated in the chart below. These price targets allow traders to set profit-taking objectives or identify regions where the next turn in prices will occur.

See 4 more ways the Wave Principle improves trading — plus the kinds of trading opportunities Elliott waves identify and how to use waves to set protective stops — in Elliott Wave International's free Special Report. Create your free account to access Learn How the Wave Principle Can Improve Your Trading.

This article was syndicated by Elliott Wave International and was originally published under the headline When Junk Bond Spreads and Stocks Diverge. EWI is the world's largest market forecasting firm. Its staff of full-time analysts led by Chartered Market Technician Robert Prechter provides 24-hour-a-day market analysis to institutional and private investors around the world.

Friday, 26 June 2026

Catching The 'Third of a Third' in AI BEFORE the Rest of the World

By Elliott Wave International

Paying attention is good. Knowing WHERE to pay attention is even better.

Leading market sectors often reveal what’s really happening beneath the surface.

In June 2017, Elliott Wave International's Global Market Perspective showed this chart and wrote:

“Leading sector indexes often provide important evidence to support or even to inform a wave count for the broader market. Nothing could be truer right now for the MSCI Emerging Markets Asia Infotech Index.

The index is leading Asian stock markets higher in a third-of-a-third-wave advance.”

What exactly did that imply?

A third wave is typically the strongest phase of a market advance. A third wave within a larger third wave—often called a “third of a third”—is where trends can accelerate dramatically.

What happened next?

As of June 2026, the MSCI Emerging Markets Asia Infotech Index has risen from roughly 500 to more than 3,500 — as in, a $10,000 investment would be worth close to $70,000.

That’s the value of paying attention in the right place.

Every month, EWI's Global Market Perspective analyzes more than 50 global markets—including stocks, commodities, currencies, bonds and emerging markets—to identify potential opportunities and risks across the globe.

The question isn’t what Global Market Perspective said in 2017.

The question is: What opportunities is it identifying today?

Subscribe to GMP today and find out >>.

Or, if you'd like to learn to spot third wave setups in your charts, this handy free resource teaches you the Elliott Wave basics in just 30 minutes >>.

This article was syndicated by Elliott Wave International and was originally published under the headline Catching The 'Third of a Third' in AI BEFORE the Rest of the World. EWI is the world's largest market forecasting firm. Its staff of full-time analysts led by Chartered Market Technician Robert Prechter provides 24-hour-a-day market analysis to institutional and private investors around the world.

Thursday, 2 April 2026

Elliott Waves Subsume Classic Technical Chart Patterns

By Elliott Wave International

Traditional technical-analysis chart patterns fit within the broader framework of the Elliott wave model.

Elliott waves subsume head and shoulders tops and bottoms, rounding tops and bottoms, triangles, rectangles, double and triple tops and bottoms, diamonds, falling and rising wedges, pennants and flags.

Let’s take just one example: the head and shoulders top. The excerpt below, from Elliott Wave Principle, shows how it fits within the Wave Principle:

In a normal wave development, wave five of 3 and wave 4 form the “left shoulder” of the pattern, wave 5 and wave A form the “head,” and wave B and wave one of C form the “right shoulder.” Wave two of C creates the return to the neckline that is typical of the pattern (below).

So, if you’re a fan of traditional technical chart patterns, the Wave Principle can consolidate them under a single model and help you determine which formations are most likely of real significance.

To learn more about Elliott wave analysis, read the definitive text on the topic -- it’s free.

This article was syndicated by Elliott Wave International and was originally published under the headline Elliott Waves Subsume Classic Technical Chart Patterns. EWI is the world's largest market forecasting firm. Its staff of full-time analysts led by Chartered Market Technician Robert Prechter provides 24-hour-a-day market analysis to institutional and private investors around the world.

Tuesday, 3 March 2026

The Idea that Peace and War Drive Stock Prices Is a Myth

By Elliott Wave International

Does an event as momentous as war affect the trend of the stock market?

Most people think so.

But the data don’t back it up.

Wars have no consistent causal effect on stocks: Sometimes the stock market rises during large-scale conflicts. Sometimes it falls. Sometimes it does both!

Just examine these charts:

There’s no reliable connection between war and stock prices. It’s a MYTH.

Chapters 1 and 2 of The Socionomic Theory of Finance debunk 12 more myths that most investors fall for.

You can read the chapters for FREE now.

This article was syndicated by Elliott Wave International and was originally published under the headline The Idea that Peace and War Drive Stock Prices Is a Myth. EWI is the world's largest market forecasting firm. Its staff of full-time analysts led by Chartered Market Technician Robert Prechter provides 24-hour-a-day market analysis to institutional and private investors around the world.

Tuesday, 4 November 2025

This Chart Should Give Bulls a Fright

By Elliott Wave International Head of Global Research Murray Gunn

Happy Halloween!

The chart below should give a fright to bulls of the stock market.

It shows the Shiller Cyclically Adjusted Price Earnings Ratio (CAPE) for the U.S. stock market. The current reading is 39.5. This is the second highest reading in the history of the data going back to 1881, just below the all-time peak of 44.2 at the start of the new millennium. Even in 1929, just before the most famous stock market crash, CAPE only got to 32.5.

Of course, there’s no reason why earnings can’t explode higher rather than share prices decline in order for CAPE to fall back. AI bulls think that way. But if history is a guide, this overvaluation of the U.S. stock market will be corrected by a grizzly bear market in stocks.

If you are prepared, it shouldn’t be a horror show.

This is just one of many warning signs flashing across financial markets.

Discover the full picture inside EWI's new FREE report: “18 Flashing Red Signals.”.

This article was syndicated by Elliott Wave International and was originally published under the headline This Chart Should Give Bulls a Fright. EWI is the world's largest market forecasting firm. Its staff of full-time analysts led by Chartered Market Technician Robert Prechter provides 24-hour-a-day market analysis to institutional and private investors around the world.

Thursday, 11 September 2025

Debunking the Reigning Theory of Stock Market Pricing

By Elliott Wave International

The reigning theory of stock market pricing says investors rationally revalue stocks as new information enters the marketplace.

If that were true, stock charts would look like this:

The stock market would trend mostly sideways, fluctuating within narrow ranges as minor bits of news mostly canceled each other out. Sharp jumps or drops to new planes of stability would occur when major news broke and investors adjusted prices to a new level.

But real market charts don’t look like that.

In reality, stock prices run wildly up and down every second, minute, hour, day, week, month, year and decade.

Almost no one questions the exogenous-cause theory of pricing.

Elliott Wave International did.

EWI tested 13 widely accepted claims that link economic, political and monetary variables to market movements.

Learn what they discovered when you read the first two chapters of Robert Prechter’s The Socionomic Theory of Finance – free..

This article was syndicated by Elliott Wave International and was originally published under the headline Debunking the Reigning Theory of Stock Market Pricing. EWI is the world's largest market forecasting firm. Its staff of full-time analysts led by Chartered Market Technician Robert Prechter provides 24-hour-a-day market analysis to institutional and private investors around the world.

Tuesday, 5 August 2025

EWAVES Has Logged 2,329 S&P Points Since February

By Elliott Wave International

How powerful is EWAVES? Let the numbers speak for themselves. Imagine acting on just two EWAVES calls this year:

February 24, 2025: EWAVES identified the termination of a 2-year long uptrend before the S&P 500 closed that day at 5983. A short there, covered at the 4982 close on April 8th when EWAVES recognized that the decline was over, would have delivered 1,001 S&P points.

April 8, 2025: EWAVES turned bullish, with waves labeled to indicate a move to new all-time highs. Buying at the close around 4982 and staying with EWAVES’ bullish opinion into the July 22nd close at 6309 (a conservative bullish target) delivered another 1,328 S&P points.

That’s a total of 2,329 S&P points, following just two calls from EWAVES. With just a single S&P E-Mini contract, those points would be worth $116,450.

This isn’t hindsight. These were real-time forecasts, made before the turns, with precise wave labeling and elliotticity confidence scores.

February 24, 2025 – Bearish Setup

April 8, 2025 – Bullish Setup

July 22, 2025 – Conservative Bullish Target Met

Want to try EWAVES Live for yourself? EWAVES offers individual investor packages for US, Australia, India, UK, Turkey and Crypto markets! Try it for yourself with a 30-day trial option. This is your opportunity to explore the world’s first genuine Elliott wave pattern recognition engine with no subscription commitment required. Learn more about EWAVES Live now and choose your package today.

This article was syndicated by Elliott Wave International and was originally published under the headline EWAVES Has Logged 2,329 S&P Points Since February. EWI is the world's largest market forecasting firm. Its staff of full-time analysts led by Chartered Market Technician Robert Prechter provides 24-hour-a-day market analysis to institutional and private investors around the world.

Friday, 1 August 2025

Proof That the Fed Doesn't Control Interest Rates

By Elliott Wave International

Before every Fed meeting, investors and pundits wait in a state of high alert. Will the Fed raise rates? Cut them? Do nothing?

They are wasting their time.

The Fed doesn’t control interest rates; it’s the other way around.

History shows that the T-bill market moves first — and the Fed follows.

On August 30, 2007, Elliott Wave International used this reliable relationship to forecast a dramatic rate cut. Three weeks later, the Fed fulfilled their prediction. And they kept doing so until T-bill rates bottomed. This chart shows how the Fed’s rate constantly lags the T-bill rate.

This relationship has held true for decades. And not just in the U.S. – but in Europe, the U.K., and Australia, too.

Chapter 3 of The Socionomic Theory of Finance tells the full story of markets’ global dominance of interest rate policy. Read it &mdash FREE — for a limited time.

This article was syndicated by Elliott Wave International and was originally published under the headline Proof That the Fed Doesn't Control Interest Rates. EWI is the world's largest market forecasting firm. Its staff of full-time analysts led by Chartered Market Technician Robert Prechter provides 24-hour-a-day market analysis to institutional and private investors around the world.

Thursday, 10 July 2025

How to Use Elliott Wave Channels in Your Analysis

By Elliott Wave International

Elliott wave channeling can help you identify price targets and realize how future trends could develop.

A properly drawn channel typically marks the upper and lower boundaries of an impulse wave (a five-wave move in the direction of the trend). Elliott channels are most useful in identifying targets for wave four and five.

The initial channeling technique for an impulse requires at least three reference points. When wave three ends, connect the points labeled 1 and 3, then draw a parallel line touching the point labeled 2, as shown below.

This construction provides an estimated boundary for wave four. (In most cases, third waves travel far enough that the starting point is excluded from the final channel’s touch points.)

If the fourth wave ends at a point not touching the parallel, you must reconstruct the channel in order to estimate the boundary for wave five. First connect the ends of waves two and four. If waves one and three are normal, the upper parallel most accurately forecasts the end of wave five when drawn touching the peak of wave three, as in the chart below.

Pro tip: If wave three is abnormally strong, almost vertical, then a parallel drawn from its top may be too high. Experience has shown that a parallel to the baseline that touches the top of wave one is then more useful. In some cases, it may be useful to draw both potential upper boundary lines to alert you to be especially attentive to the wave count and volume characteristics at those levels and then take appropriate action as the wave count warrants.

Try Elliott Wave International's Trader's Classroom for only $1 per day

For a limited time, $30 gives you 30 days of access to EWI's Trader’s Classroom — a trusted service for traders looking to elevate their skills.

In a recent lesson, EWI veteran instructor Favio Poci shows you step-by-step how he applies Elliott wave channels in real time. His latest class is waiting for you inside.

Start your test-drive today.

This article was syndicated by Elliott Wave International and was originally published under the headline How to Use Elliott Wave Channels in Your Analysis. EWI is the world's largest market forecasting firm. Its staff of full-time analysts led by Chartered Market Technician Robert Prechter provides 24-hour-a-day market analysis to institutional and private investors around the world.

Thursday, 3 July 2025

Third Waves Are the Ones You Want to Catch

By Elliott Wave International

"Third waves are wonders to behold. They are strong and broad.

They usually generate the greatest volume and price movement and are most often the extended wave in a series."

-- Elliott Wave Principle, Frost and Prechter, p. 78

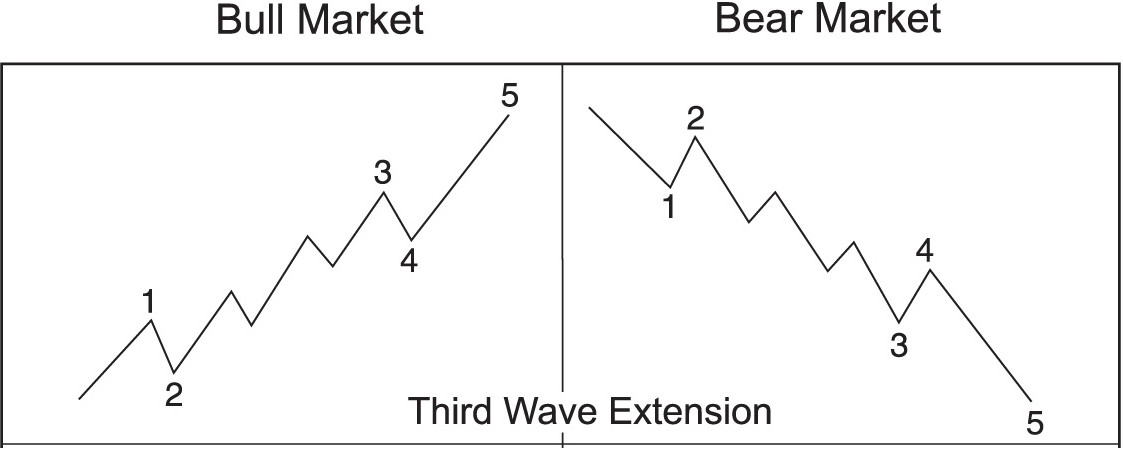
Of the five waves in an Elliott impulse, the 3rd wave is the one you want to catch.

And you definitely don't want to be on the wrong side of one.

These idealized charts show you what I mean.

Every Elliott fan has a handful of favorite 3rd waves.

Mine? Bitcoin in 2020.

In April 2020 -- amid the COVID-19 panic -- Elliott Wave International's analysts told subscribers:

"Bitcoin (BTC) is in the very early stages of a wave (3) rally... keep the focus on higher."

Result: Bitcoin rocketed from 7,000 to nearly 65,000 in a year.

Not every 3rd wave is this dramatic, of course.

Bitcoin in 2020 is an important reminder that 3rd waves are most often the longest and strongest move in an Elliott impulse.

Want to learn more about the Elliott Principle? This handy reference guide teaches you the basics in 30 minutes (it's free).

This article was syndicated by Elliott Wave International and was originally published under the headline Third Waves Are the Ones You Want to Catch. EWI is the world's largest market forecasting firm. Its staff of full-time analysts led by Chartered Market Technician Robert Prechter provides 24-hour-a-day market analysis to institutional and private investors around the world.