By Elliott Wave International
Technical studies do a good job of illuminating the way for traders, yet they each fall short for one major reason: they limit the scope of a trader’s understanding of current price action and how it relates to the overall picture of a market. Most technical studies simply don’t reveal pertinent information such as the maturity of a trend and a definable price target — but the Wave Principle does.
Here is one way the Wave Principle provides perspective:
Provides Price Targets
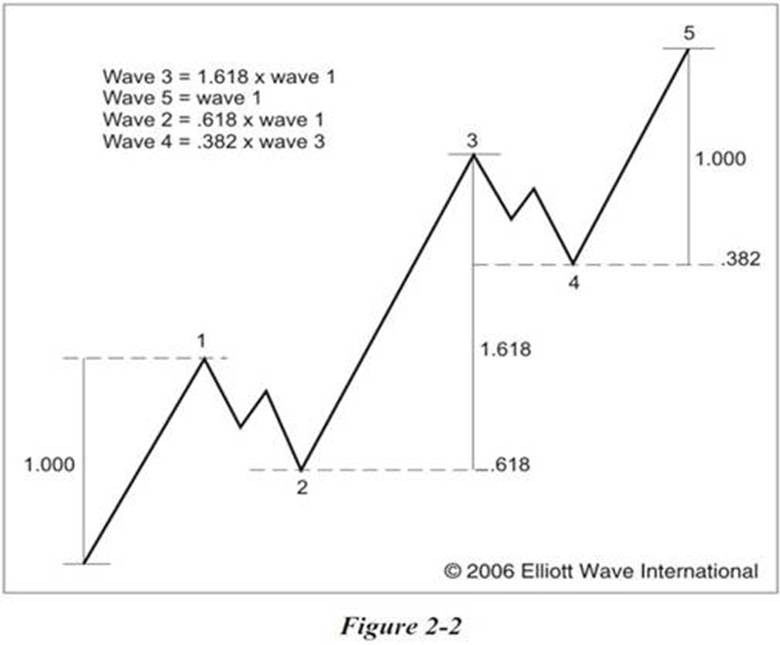
What traditional technical studies simply don’t offer — price targets — the Wave Principle again provides. R.N. Elliott observed that the Fibonacci sequence is the mathematical basis for the Wave Principle. Elliott waves, both impulsive and corrective, often adhere to Fibonacci proportions, as illustrated in the chart below. These price targets allow traders to set profit-taking objectives or identify regions where the next turn in prices will occur.
See 4 more ways the Wave Principle improves trading — plus the kinds of trading opportunities Elliott waves identify and how to use waves to set protective stops — in Elliott Wave International's free Special Report. Create your free account to access Learn How the Wave Principle Can Improve Your Trading.
This article was syndicated by Elliott Wave International and was originally published under the headline When Junk Bond Spreads and Stocks Diverge. EWI is the world's largest market forecasting firm. Its staff of full-time analysts led by Chartered Market Technician Robert Prechter provides 24-hour-a-day market analysis to institutional and private investors around the world.