Friday, 27 June 2025

This Time, Don't Fall For It Supply and Demand Don’t Drive Oil Prices

By Elliott Wave International

OPEC cuts production. International conflict blocks key shipping routes. A hurricane shuts down offshore rigs.

Conventional wisdom says prices should rise — and keep climbing.

But does the evidence support this assumption?

Take Hurricane Katrina in 2005. It shut down 95% of Gulf oil production — a quarter of total U.S. output.

So what happened to oil prices?

They fell over 20% in the three months that followed.

You can’t rely on supply and demand to forecast oil prices. That’s not how markets work.

Want to know what does drive oil prices?

In 2016, @elliottwaveintl’s Robert Prechter showed decades of market data that prove supply and demand do not regulate oil prices. More importantly, he revealed a method for forecasting oil with striking accuracy.

For a limited time, you can watch Prechter's 35-minute presentation — "What Really Drives Oil Prices?" — to find out.

Don’t miss this one. Viewers call it one of the best market presentations they’ve ever seen.

EWI is the world's largest market forecasting firm. Its staff of full-time analysts led by Chartered Market Technician Robert Prechter provides 24-hour-a-day market analysis to institutional and private investors around the world.

Friday, 13 June 2025

Debt Ceiling Drama

By Elliott Wave International

What’s another few trillion dollars? U.S. debt is already approaching a historic $37 trillion and now, Congress is discussing adding at least another $3 trillion to the “debt ceiling.” Yes, that’s the phrase that many hear on the news but know little about. Our June Global Rates & Money Flows sheds some historic light on the topic:

Get ready for a summer of apprehension in America as the financial markets fixate on the level of U.S. Federal government debt and whether lawmakers allow the legal limit on it to be (once again) raised. What is the “debt ceiling” and does it really matter?

Simply put, the U.S. debt ceiling refers to a law limiting the amount of money the U.S. government can borrow. Up until 1917, Congress would approve each and every tranche of government borrowing but because World War I was proving so costly, to enable flexibility Congress passed the Second Liberty Bond Act in which it established a limit (ceiling) on the amount of new bonds that could be issued. In 1917 that limit was set at $11.5 billion. Just over a century later it is now $36.1 trillion! In the infamous words of the room service waiter when, having brought champagne and caviar to his hotel room at 3AM, seeing George Best, the world’s greatest footballer at the time, naked along with three Miss World beauty contestants on a bed full of banknotes from casino winnings, ‘Where did it all go wrong?’

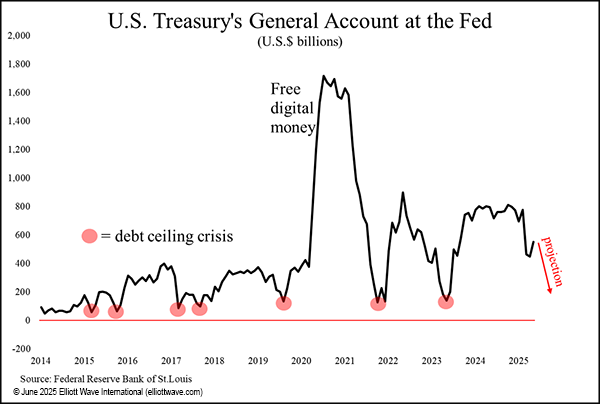
The chart above shows the amount of money in the U.S. Treasury’s General Account that it has at the Federal Reserve Bank. Think of this as just like a checking account we all have at a bank. Receipts, like taxes, come in and expenses, like payroll for government employees and interest on Treasury bonds, go out. The aim, as we all know, is to keep our checking accounts above the zero line.

As you can see, when the account gets towards zero, that is when debt ceiling crises have happened in the past because it means that unless the debt ceiling is either raised or suspended, the Treasury will not be able to pay its day-to-day legal obligations.

Want more market insights like this? Sign up to get them sent straight to your inbox – FREE.

This article was syndicated by Elliott Wave International and was originally published under the headline Debt Ceiling Drama. EWI is the world's largest market forecasting firm. Its staff of full-time analysts led by Chartered Market Technician Robert Prechter provides 24-hour-a-day market analysis to institutional and private investors around the world.

Thursday, 5 June 2025

Elevate Your Elliott Wave Analysis

By Elliott Wave International

RULES are great. They tell you what you can't do. The Elliott Wave Principle has three.

In a five-wave impulse (shown in the chart below):

  • Wave 2 can never retrace more than 100% of wave 1
  • Wave 3 can never be the shortest of waves 1, 3 and 5
  • Wave 4 can never end in the price territory of wave 1

But GUIDELINES tell you what's PROBABLE. And that's what you want to know!

For instance, the guideline of alternation states that if wave two of an impulse is a sharp retracement, expect wave four to be a sideways correction, and vice versa. The chart below illustrates.

Sharp corrections are almost always zigzags (single or double). Sideways corrections include flats, triangles and combinations.

Not quite ready for the quiz? We have a handy reference guide that can help — and it’s free:

Learn the basics of the Elliott Wave Principle in just 30 minutes.

Elevate YOUR Elliott! Access Jim's course for free now

This article was syndicated by Elliott Wave International and was originally published under the headline Elevate Your Elliott Wave Analysis. EWI is the world's largest market forecasting firm. Its staff of full-time analysts led by Chartered Market Technician Robert Prechter provides 24-hour-a-day market analysis to institutional and private investors around the world.