Tuesday, 25 March 2025

What Goes Around Comes Around

By Elliott Wave International

Excerpted from Elliott Wave International's March 2025 Global Market Perspective:

The Conference Board's survey of consumer confidence dropped sharply in February, coming in much lower than economist expectations. The current reading of 98.3 stands in contrast to its peak of 144.7 which was made a quarter of a century ago in February 2000. The chart below shows a similar dynamic for the University of Michigan measurement of consumer confidence which also peaked in February 2000.

There is a relationship between consumer sentiment and the stock market. Why then, if the S&P 500 is hovering near all-time highs has consumer sentiment declined over the past 25 years? The answer lies in the fact that, in real terms, adjusted for the growth in money supply, the stock market is still below its peak from 1999. Using that sociometer, social mood has been trending negatively since the start of the century, backed up by these readings in consumer confidence.


EWI's State of the Global Markets -- In Progress

Now through April 2, Elliott Wave International's State of the Global Markets event gives you forecasts for every major market in the world.

You get free access to the entire March 2025 issue of Global Market Perspective, section by section -- including global stocks, interest rates, forex, cryptos, gold & silver, crude oil, and more.

EWI don't share this analysis very often. And when they do, it's the most popular event of the year. Don't miss it!

Join State of the Global Markets now.

This article was syndicated by Elliott Wave International and was originally published under the headline What Goes Around Comes Around. EWI is the world's largest market forecasting firm. Its staff of full-time analysts led by Chartered Market Technician Robert Prechter provides 24-hour-a-day market analysis to institutional and private investors around the world.

Thursday, 13 March 2025

Tesla's Troubles — Is it Musk or is it More?

By Elliott Wave International

Tesla tumbled 15% on March 10, its biggest single day drop in more than five years. Elliott Wave International's March Global Market Perspective provides this insight:

The world's richest man, Elon Musk, is also more vulnerable than most people realize. In March 2023, when a poll by Heatmap News, a website that focuses on climate news, showed that prospective electric-vehicle buyers were less likely to buy a Tesla due to Musk's behavior, the Global Market Perspective argued that his persona is so "attached to a bull market that even small shifts in social mood can damage his public cachet irreparably." Tesla's stock price has made no net progress since January 2021 and is down 42% from its all-time high in December 2024. In January, Germany's Federal Motor Transport Authority reported that just 1,300 new Teslas were registered, the lowest monthly total since July 2021. Across Europe's three largest electric vehicle markets -- Germany, France and Britain -- yearly sales were off 59%, 63% and 12%, respectively. Meanwhile, the average price of a used Tesla recently fell below $32,000, down from nearly $68,000 in 2022:

Tesla's stock price is now less than half its peak only three months ago. Think there may be trouble brewing elsewhere too? Delve into the more than 50 pages of EWI's comprehensive Global Market Perspective by following this link.

If you'd like to sample EWI's analysis before subscribing, check out their special Global Market's Highlights -- FREE.

This article was syndicated by Elliott Wave International and was originally published under the headline Tesla's Troubles — Is it Musk or is it More?. EWI is the world's largest market forecasting firm. Its staff of full-time analysts led by Chartered Market Technician Robert Prechter provides 24-hour-a-day market analysis to institutional and private investors around the world.

Thursday, 6 March 2025

Are the Birds to Blame?

By Elliott Wave International

Egg prices have skyrocketed. Is there another force at work besides the Avian flu? Read this analysis from Elliott Wave International's Global Rates & Money Flows that you likely won't find in the mainstream media:

Commodity indices have a bullish tilt to them from a higher-degree Elliott wave perspective and so we fully expect another bout of food price inflation to come through in the coming years (something which ties in with our outlook for higher bond yields). Right now, there is a panic about the price of eggs.

Egg prices have skyrocketed in recent months. In September 2023 a dozen eggs would have cost you just over $1 in the U.S. Now it will cost you over $7. What the (s)hell is going on? Avian flu outbreaks are the most common rationalization for the price increase but there’s also an underlying sentiment that food prices in general have entered a more inflationary era.

The chart below shows that egg prices fluctuate in quite a rhythmical manner and so we fully expect prices to decline again at some point. In the meantime, enjoy those expensive omelettes:

For a free sample of EWI's Commodities coverage, check out their Highlights Issue on Commodities by following this link.

This article was syndicated by Elliott Wave International and was originally published under the headline Are the Birds to Blame?. EWI is the world's largest market forecasting firm. Its staff of full-time analysts led by Chartered Market Technician Robert Prechter provides 24-hour-a-day market analysis to institutional and private investors around the world.

Wednesday, 26 February 2025

PepeCoin (PEPE): Anticipating Reversals using Elliott Waves

By Elliott Wave International

With just a basic understanding of the Elliott Wave Principle, you have a tool that can help you anticipate trends and trend changes.

The Wave Principle says that markets move in five waves in their primary direction (motive waves) and three waves in the countertrend direction (corrective waves).

Once a 5-wave impulse is complete, you can expect at the very least a 3-wave correction in the opposite direction.

Here's a recent real-world example that shows how Elliott Wave International's analysts were able to identify the end of a 5-wave move and the reversal that followed.

On December 6, EWI shared with subscribers this forecast for altcoin PEPE:

"Look for wave (5) to end near 0.00002630, the 1.618 multiple of wave (1)."

Result: PEPE rallied as forecast to complete wave (5) and then reversed course swiftly.

So, where's the next opportunity in cryptos?

See for yourself inside EWI's Crypto Opportunity Month. You'll find their detailed wave outlook for altcoins including PepeCoin and major cryptos: Bitcoin, Ethereum, XRP, Litecoin, Solana, Cardano and more.

Want to learn more about the Wave Principle? EWI's handy guide teaches you the essentials in just 30 minutes (it's free!)

This article was syndicated by Elliott Wave International and was originally published under the headline PepeCoin (PEPE): Anticipating Reversals using Elliott Waves. EWI is the world's largest market forecasting firm. Its staff of full-time analysts led by Chartered Market Technician Robert Prechter provides 24-hour-a-day market analysis to institutional and private investors around the world.

Thursday, 6 February 2025

Valuations Are at the Furthest Edge of the Financial Solar System

By Robert Prechter, excerpted from the January 2025 Elliott Wave Theorist.

Figure 1 updates our history of year-end valuations for stocks of S&P companies on two bases: price to book value (Y axis) and dividend yield (X axis). I thought the year-end 2021 overvaluation would never be surpassed. But as you can see, the year-end 2024 reading is both higher and further to the right. It is the highest multiple ever recorded for S&P Industrials’ price to book value and the fifth-lowest level for the S&P Composite’s dividend yield, the four lower readings all occurring in 1998-2001.

We have long called this our Pluto chart. Perhaps we should have expected another extreme valuation near that of 2021. After all, Pluto was discovered to be a planet pair.

The extreme readings of 1998-2001 stayed within the dashed-line channel, but the past six years’ closing valuations are all beyond it. In three of those years — 2021, 2023 and 2024 — price to book value was above that of 1999, the year of the all time high in stock indexes priced in real money (gold)...

Continue reading – free at elliottwave.com..

Thursday, 30 January 2025

Another Blowout Ahead for Credit Spreads?

By Elliott Wave International

Credit investors aren't worried about a thing. They sneer at the possibility of a recession. A slew of corporate defaults? Nah. Complacency is so extreme that Elliott Wave International's December Global Market Perspective warned that a tipping point might be at hand:

Two of the most important credit-market sentiment indicators in the United States point to extreme optimism. On November 8, investment-grade credit spreads (left chart below) narrowed to just 74 bps, their tightest level in nearly three decades. One week later, high-yield (i.e. junk) spreads fell to 253 bps, their tightest level in nearly two decades. The equivalent spreads in Europe have narrowed to their tightest levels since early 2022:

What do these extremes mean? As we discussed in March, investors buy riskier corporate debt (over treasuries) when they view the future optimistically, causing spreads to narrow. In contrast, they buy safer treasuries (over corporates) when they view the future pessimistically, causing spreads to widen. As shown, the three major financial crises over the past two decades reached their zenith as terrified investors sold corporate bonds indiscriminately.

Are credit spreads preparing for another blowout? A decade ago, EWI observed a compelling pattern in equities, whereby European stocks peaked "prior to major tops in the Dow" (Elliott Wave Financial Forecast, July 2013). The pattern was best exemplified by the FTSE 100, which peaked one month before the DJIA in 1987, seven months before the DJIA in 1990, two weeks before the DJIA in 2000, and three months ahead of the DJIA in 2007. Could Europe's credit markets be signaling similar trouble?

Credit spreads in key sectors have already started to widen. Plus, EWI's January Global Market Perspective shows a highly revealing 3.4-year cycle of U.S. corporate high-yield spreads which directly relates to the year – 2025. Get Global Market Perspective insights now by following this link.

Not ready to subscribe? Try a sample first. Read EWI's FREE highlights issue on Global Markets.

This article was syndicated by Elliott Wave International and was originally published under the headline Another Blowout Ahead for Credit Spreads?. EWI is the world's largest market forecasting firm. Its staff of full-time analysts led by Chartered Market Technician Robert Prechter provides 24-hour-a-day market analysis to institutional and private investors around the world.
Thursday, 23 January 2025

Will the Fed Do an About-Face in 2025?

By Elliott Wave International

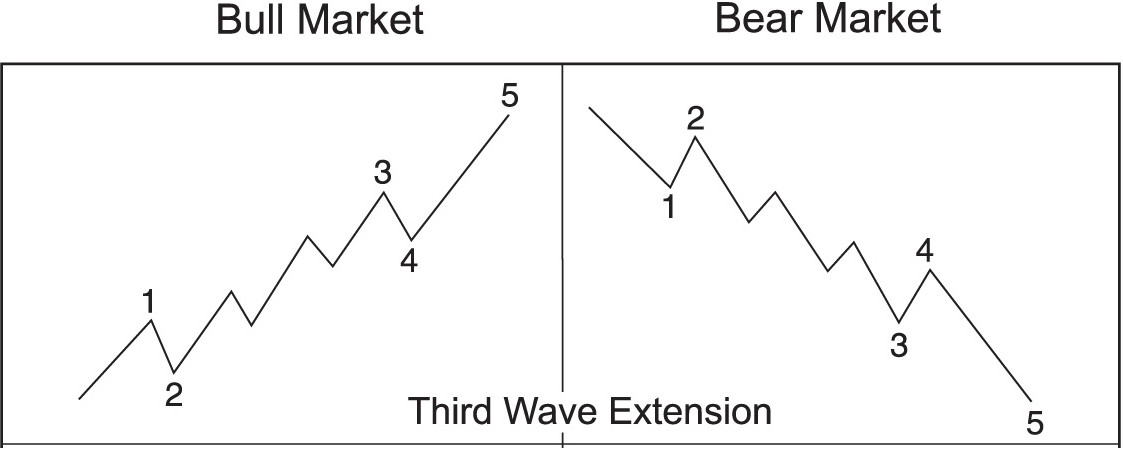
Would you like the ability to predict what the Fed will do with its fed funds rate? Just watch the bond market. Elliott Wave International's August Financial Forecast did just that and predicted the Fed would “play catch up.”

The chart below shows the current fed funds rate relative to the yield on both 3-month and 6-month U.S. T-bills:

This week, the yield on both T-bills closed at their lowest levels in a year and have dropped well below the fed funds rate. Based on the current level of T-bill yields, the pressure is mounting on the Fed to lower the fed funds rate to align with T-bill rates, which again are signaling impending economic weakness. The Fed had its chance on Wednesday to lower its rate but did not act. Why? Because, as Chapter 3 of The Socionomic Theory of Finance notes, the average lag time is five months, and the rate decline began accelerating only a month ago. Of course, the more the Fed waits, the more dramatic their reduction will be as they play catch-up to the market. If U.S. T-bills are at current levels or lower by the time of the next Fed meeting on September 18, our model predicts that the Fed will lower the fed funds rate commensurately with the lower level of T-bill yields. [emphasis added]

Indeed, the Fed lowered the fed funds rate by 50 basis points in September. It was the first time the central bank had cut rates in four years. Two other rate cuts followed (November and December) in 2024.

What decisions will the Fed make in 2025? Follow this link to get EWI's current bond market insights by reviewing their new January Elliott Wave Financial Forecast.

Speaking of The Socionomic Theory of Finance, learn how financial markets really work by watching this video from Robert Prechter – it’s FREE.

This article was syndicated by Elliott Wave International and was originally published under the headline Will the Fed Do an About-Face in 2025?. EWI is the world's largest market forecasting firm. Its staff of full-time analysts led by Chartered Market Technician Robert Prechter provides 24-hour-a-day market analysis to institutional and private investors around the world.

Wednesday, 15 January 2025

Elevate Your Elliott Wave Analysis

By Elliott Wave International

RULES are great. They tell you what you can't do. The Elliott Wave Principle has three.

In a five-wave impulse (shown in the chart below):

  • Wave 2 can never retrace more than 100% of wave 1
  • Wave 3 can never be the shortest of waves 1, 3 and 5
  • Wave 4 can never end in the price territory of wave 1

But GUIDELINES tell you what's PROBABLE. And that's what you want to know!

For instance, the guideline of alternation states that if wave two of an impulse is a sharp retracement, expect wave four to be a sideways correction, and vice versa. The chart below illustrates.

Sharp corrections are almost always zigzags (single or double). Sideways corrections include flats, triangles and combinations.

Not quite ready for the quiz? We have a handy resource that can help -- and it's free for a limited time:

How to Use Elliott's Rules and Guidelines to Label Charts Correctly

In this on-demand course, EWI veteran analyst Jim Martens gives you practical tools and tips to help you improve your wave application. It's a powerful resource for newbies and experienced wavers alike.

Elevate YOUR Elliott! Access Jim's course for free now

This article was syndicated by Elliott Wave International and was originally published under the headline Elevate Your Elliott Wave Analysis. EWI is the world's largest market forecasting firm. Its staff of full-time analysts led by Chartered Market Technician Robert Prechter provides 24-hour-a-day market analysis to institutional and private investors around the world.
Tuesday, 7 January 2025

Debt, Defaults and Delinquencies (Oh My!)

By Elliott Wave International

It's a double whammy: U.S. credit card defaults jump to the highest level since 2010 as personal savings dry up. Expectations for the months ahead are even more glum. Elliott Wave International lay it out in their November Financial Forecast:

The latest New York Fed Consumer Loan Survey reveals that consumers' expectations for delinquencies rose to 14.22% in September, as shown on the chart below. Over the past seven years, the only higher readings came in March and April 2020 in the midst of the last U.S. recession:

The survey goes back only to 2013, but the history of consumer loan delinquencies suggests that the next debt crisis will be way more disruptive than those of the 2000s. Ahead of the relatively mild recession that began in the first quarter of 2001, for instance, delinquency rates on consumer loans barely budged, rising less than 1% from March 2000 to the start of the recession in March 2001, according to the Fed. By the end of that recession, the consumer loan delinquency rate was actually lower than it was at the beginning of the economic contraction. As its moniker suggests, the Great Recession of 2007-2009 was rockier. Ahead of the recession that began in December 2007, consumer loan delinquencies rose for two full years to 2.64%. At the end of the recession in June 2009, the delinquency rate was at a modern-day high of 4.85%. The current setup suggests a bigger rise in delinquencies. As of mid-2024, the rate has been rising steadily for 3 years and 9 months, from 1.52% in the third quarter of 2021, which was the lowest level in the Fed's half century of data. Currently at 2.74%, consumer loan delinquencies are up 79%. "Consumers Have a Debt Problem," says a headline from The Wall Street Journal on September 16. The subhead adds that they are therefore "leaning on credit cards as other sources of credit have dried up." This trend is untenable as the latest Forbes survey places the average credit card interest rate at 28.7%.

Want more? Get free samples of EWI's financial analysis sent straight to your inbox >>

This article was syndicated by Elliott Wave International and was originally published under the headline Debt, Defaults and Delinquencies (Oh My!). EWI is the world's largest market forecasting firm. Its staff of full-time analysts led by Chartered Market Technician Robert Prechter provides 24-hour-a-day market analysis to institutional and private investors around the world.