Thursday, 29 May 2025

Parallel to the Great Recession

By Elliott Wave International

Is the U.S. economic contraction of 0.3% in Q1 a warning of what’s ahead? Well, even a month before the start of Q1, Elliott Wave International's December Financial Forecast laid out data which spoke for itself – and the message still applies:

This chart below shows that the Conference Board’s Leading Economic Index (LEI) peaked in December 2021. The index has not had an uptick for 32 consecutive months, since February 2022. It’s now at its lowest level since March 2016. In the history of the data back to 1959, there has never been a turndown of this magnitude without an ensuing recession:

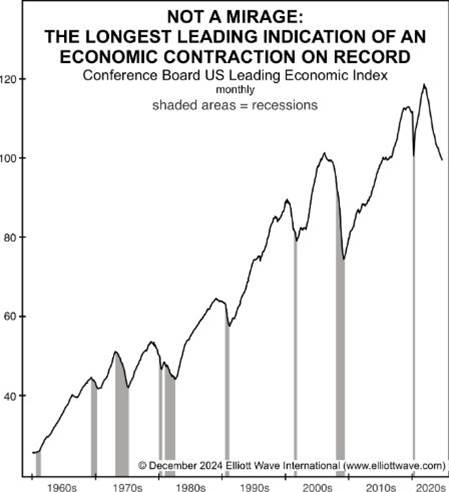
The current LEI decline is a Fibonacci 34 months old, starting at the December 2021 high. Prior to the current contraction, the longest LEI decline prior to a recession was a Fibonacci 21 months, from March 2006 to December 2007. It was followed by the steepest economic contraction since the Great Depression.

Mind you, at the time EWI's Financial Forecast made the case to expect economic contraction, the consensus among economists was that the Fed had succeeded in raising interest rates just enough to curtail inflation but not inhibit economic growth. So much for the consensus.

If a recession (or worse) is ahead, you’ll want to get ready. Read EWI's report, “Preparing for Difficult Times” – it’s FREE.

Tuesday, 20 May 2025

EURUSD: What the News Reported After the Fact -- and What Our Subscribers Knew in Advance

By Elliott Wave International

Over the past six months, major currency markets have seen some dramatic moves.

Mainstream financial media has largely pointed to two key drivers:

  1. The 2024 U.S. presidential election
  2. The Federal Reserve

These explanations may seem logical in hindsight. But markets rarely move in neat correlation with headlines. A more useful question might be: Who was tracking these moves before they happened?

Take EURUSD -- the world's most actively traded currency pair. From October 2024 to mid-January 2025, the pair declined sharply, reaching a 14-month low.

Elliott Wave International's September 2024 Global Market Perspective (GMP) noted that a B wave peak was likely in place, and it projected a downward C wave to follow. That analysis came well before the U.S. election on November 5.

Then on November 1, just days before the vote, GMP called for "significant weakness" in EURUSD. That same day, EWI's Short Term Update (STU) identified that "the trend is down." This wasn't based on political speculation -- it was based on market patterns we've studied for decades.

Fast-forward to January: on the 3rd, GMP anticipated a major reversal in EURUSD. Ten days later, on January 13, STU called for "a multi-month rally" -- which began the very same day.

As prices climbed into February and March, STU kept subscribers informed of short-term pullbacks and the larger upward trend. And ahead of another sharp move on April 21, financial headlines once again turned to political themes.

Yet on April 16, STU had already flagged a notable sentiment shift and the potential for a downturn.

The takeaway? While news tends to explain moves after they happen, EWI's analysis focuses on anticipating them -- using Elliott wave patterns and market behavior.


See What’s Next for Key Currency Pairs

Join EWI Senior Currency Strategist Michael Madden on Thursday, May 22 at 1PM Eastern for a real-time look at the Elliott wave patterns in the U.S. dollar -- and what they might mean for major currency pairs in the days ahead. There are two ways to attend the live session.

Here's how to get your seat

Tuesday, 6 May 2025

An Elliott Wave Setup You'll See Again and Again

By Elliott Wave International

In his "3 Favorite Trading Setups" course, EWI senior analyst and instructor Robert Kelley teaches you the wave setups he trusts the most — including this Elliott wave triangle setup he called in COST in real time:

"Costco looks like a nice triangle on the bigger picture. Overall, I think it should bottom soon and go up to new highs."

Contracting triangles are often easy to spot because of their range-bound and sideways movement. The pattern contains five overlapping waves that are labeled A-B-C-D-E. Each of the five waves subdivide into three waves. Once complete, you can expect a thrust beyond the origin of wave A.

Result: Costco's price thrust to new highs as forecast, more than doubling!


Limited Time: Get FREE access to "Robert Kelley's 3 Favorite Trade Setups"

In his popular 1-hour trading course, Robert Kelley teaches you the same 3 setups he looks for in his own charts when trying to spot a market opportunity. He likes these particular setups because they're high-confidence, low-risk, and easy to spot.

You can learn all 3 today!

Access the course for free.

This article was syndicated by Elliott Wave International and was originally published under the headline An Elliott Wave Setup You'll See Again and Again. EWI is the world's largest market forecasting firm. Its staff of full-time analysts led by Chartered Market Technician Robert Prechter provides 24-hour-a-day market analysis to institutional and private investors around the world.